
Relationships & Logic
Trace Logic
Trace Logic is a selected-activity pred/succ view; not TASKPRED or Activity Network; no XER table
What a planner means
Trace Logic is a view. Oracle Professional: it "enables you to step forward or backward through a sequence of activities to focus on predecessor/successor relationships." It is "displayed in the lower layout" and "represents relationships for an activity you select in the Activity Table, Activity Network, Activity Usage spreadsheet, or Gantt Chart currently displayed in the upper layout." It is not the TASKPRED table (TASKPRED (Activity Relationships)), not the FS/SS/FF/SF types (FS / SS / FF / SF + Lag (Planner Language)), not Longest Path (Driving Relationships vs Longest Path vs “critical”), not Calculate multiple float paths (Multiple Float Paths Rank Chains; They Are Not Longest Path or TF Critical), and not Visualizer / TSLD (Visualizer).
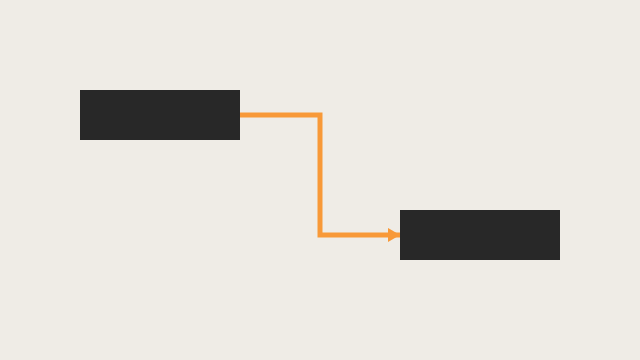
Professional — Activities window active: View > Show on Bottom > Trace Logic, or Layout Options bar > Show on Bottom, Trace Logic, or the Bottom Layout toolbar (Shows or hides Trace Logic; corresponding menu: View > Show on Bottom > Trace Logic). Oracle: "Trace Logic displays a graphical view of only the selected activity's relationships." The selected activity "appears with a blue border." "Activity boxes to the left of the selected activity are predecessors. Activity boxes to the right of the selected activity are successors." "A red border around an activity box indicates a critical activity." "A line connecting activity boxes indicates an activity relationship."
Oracle: "The activity boxes in Trace Logic display the same information as the boxes defined for the current Activity Network layout."
Use the layout to "Examine an activity and its predecessors and successors" and "Determine why an activity is scheduled at a particular time," answering: "Were any of its predecessors delayed? Do any of its predecessors or successors have an obsolete constraint? Are two activities that should be linked start to start currently linked finish to start? Why is there negative float?"
Zoom: "Zoom in or out without affecting the level of detail displayed in the upper layout."
Set Trace Logic preferences — View > Bottom Layout Options, or Layout Options bar > Bottom Layout Options. Oracle: "specify how many levels of predecessors and successors you want to view." That page: "Specify the number of predecessors you want to display." "Specify the number of successors you want to display." Apply "To preview your changes."
Activity Network is a different layout. Oracle: Activity Network is Show on Top. It "displays your project as a diagram of activities and relationships according to the work breakdown structure (WBS)." You can "Combine the Activity Network with a Trace Logic layout to focus on a specific sequence of activities." The Activity Network page also lists "Focus on the driving relationship path" as a use of Activity Network. The Professional Trace Logic pages fetched do not print driving / non-driving, solid vs dashed, or critical relationship lines.
EPPM web — Activities page Trace Logic detail window. Oracle About Trace Logic: "a graphical display of dependency relationships for an activity." "This alternative viewing format enables you to examine a path of relationships while still viewing the entire project." You "view activity relationships in the Trace Logic detail window"; you "manage activity relationships using the detail windows or Gantt chart." Getting here: Projects > Activities, select an activity, click the Trace Logic detail window.
EPPM visual cues Oracle printed on About Trace Logic / the detail window (do not copy these onto the Professional pages above):
- Selected activity "highlighted in blue"; detail window: "The selected box has a heavy blue border."
- "Activity boxes with a red border represent critical activities."
- Left = predecessors; right = successors.
- "Solid lines represent driving relationships, while dashed lines represent non-driving relationships."
- Detail window also: "Solid red lines between boxes represent critical relationships."
- "Boxes with a black diamond in the corner represent milestones."
- "A status icon in the corner of the box identifies In Progress, Completed, and Critical activities."
- Boxes show "Activity Name, Activity ID, Start Date and Finish Date." "You cannot customize activity boxes in Standard View."
- Predecessor Levels / Successor Levels: "The number of predecessor [successor] levels to show for the selected activity."
- Zoom In, Zoom Out, Zoom to 100%, Zoom to Fit.
- "If you have more than one activity or a grouping band selected, the detail window will not be visible."
EPPM About Trace Logic asks the same schedule questions (delayed predecessors, obsolete constraint, SS vs FS, negative float).
XER
The view is a layout (Professional bottom layout) or a detail window (EPPM). Oracle's project XER data map TOC lists no TRACE, TRACELOGIC, TRACE_LOGIC, or TRACE table. Do not invent one. Relationships are TASKPRED. TASK.driving_path_flag is labeled Longest Path, not this view. The cited TASKPRED map has no driving column. Oracle did not name an XER table or column for predecessor/successor level settings.
A Viewer parse of one XER cannot reconstruct which activity was selected, how many pred/succ levels were shown, or the last Trace Logic picture.
Microsoft Project
Desktop Project has three different objects. None is P6 Trace Logic.
Task Path — Gantt Chart Format tab > Task Path. Microsoft: "display a task path to highlight how tasks link to each other." Picks: Predecessors ("Tasks that link to and come before the selected task"); Driving Predecessors ("Tasks that come before the selected task and directly impact it. When the driving predecessor task moves, the selected task also moves."); Successors; Driven Successors ("When the selected task moves, the driven successor task also moves."). Remove Highlighting clears it. That is Gantt-bar highlighting, not a P6 bottom-layout box diagram.
Task Inspector — Task tab > Inspect Task. Microsoft: "use the Microsoft Project task inspector to see how changes to one task affect the rest of the project." A per-task pane of drivers. See Check Schedule.
Network Diagram — View > Network Diagram. Microsoft: "a graphical way to view tasks, dependencies, and the critical path." "Boxes (or nodes) represent tasks, and dependencies show up as lines that connect those boxes." Closer to P6 Activity Network (Show on Top) than to Trace Logic (Show on Bottom / selected-activity chain).
Do not map any of those as the same command as Trace Logic. Do not claim MPXJ can write a real MPP.
Don't
- Treat Trace Logic as TASKPRED, as the relationship-type enum, as Longest Path, as multiple float paths, or as Visualizer / TSLD.
- Treat it as Activity Network (Show on Top / full WBS diagram).
- Invent a TRACE / TRACELOGIC / TRACE_LOGIC XER table, or treat TASKPRED or
TASK.driving_path_flagas this view. - Copy EPPM solid/dashed driving lines, solid-red critical relationship lines, milestone diamond, status icons, Standard View box sentence, or "hidden if more than one activity" onto Professional as if Oracle printed them there.
- Copy Professional "boxes display the same information as the current Activity Network layout" onto EPPM as if Oracle printed it there.
- Map this object to MSP Task Path, Task Inspector, or Network Diagram and call them the same.
- Claim MPXJ writes a real MPP.
- Claim a Viewer reconstructed the planner's last Trace Logic selection or level settings from an XER.
Sources
- Oracle Trace Logic [27 Aug 2026]
- Oracle Display Trace Logic [27 Aug 2026]
- Oracle View activity relationships in Trace logic [27 Aug 2026]
- Oracle Set Trace Logic preferences [27 Aug 2026]
- Oracle Bottom Layout toolbar [27 Aug 2026]
- Oracle Activity Network [27 Aug 2026]
- Oracle About Trace Logic [27 Aug 2026]
- Oracle Trace Logic Detail Window of the Activities Page [27 Aug 2026]
- Oracle XER project map TOC [27 Aug 2026]
- Oracle XER TASKPRED [27 Aug 2026]
- Oracle XER TASK [27 Aug 2026]
- Microsoft Highlight how tasks link to other tasks [27 Aug 2026]
- Microsoft View and track scheduling factors [27 Aug 2026]
- Microsoft Create a Network Diagram in Project desktop [27 Aug 2026]