
Views, Filters & Print
Tracking
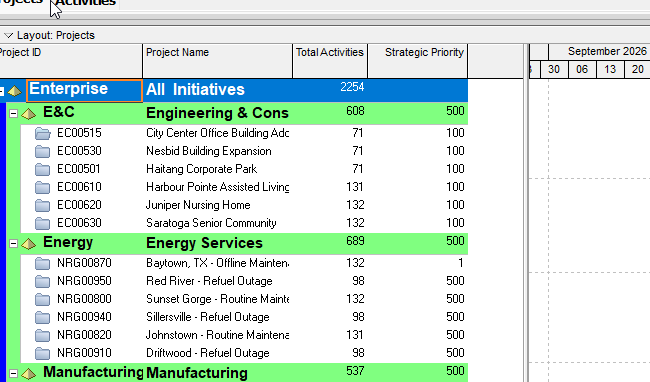
Tracking is Enterprise > Tracking (Project Explorer / Resource Explorer; four layout types including Resource Analysis and Project Gantt/Profile); not…

What a planner means
Tracking is a window. Oracle: "Use the Tracking window for monitoring a project's progress using different types of layouts." "The tracking features assist you in performing schedule, cost, and resource analysis by enabling you to access, display, and manipulate project data in a variety of formats." It is not Resource Usage Profile (Resource Usage Profile — Activities Show on Bottom resource/role histogram), not Activity Usage Profile (Activity Usage Profile — Activities Show on Bottom activity histogram), not Resource Usage Spreadsheet (Resource Usage Spreadsheet), not Activity Usage Spreadsheet (Activity Usage Spreadsheet), not typed future-period buckets (Future Period Buckets Are Typed Assignment Units, Not a Curve), not high-level Planning-page demand (High-Level Planning Assignments Sit on WBS or Project, Not TASK), not the Summarizer command (Summarizer Stores Rolled-Up EPS Totals; It — Tracking displays summarized data for closed projects), and not Publication / Enable Publication (Publication).
Professional — Enterprise > Tracking, or the Enterprise toolbar. Oracle: "After opening the Tracking window, the window remains open until you close it; if you open or navigate to another window without closing the Tracking window, click the Tracking tab to return to the window at any time." This is not View > Show on Bottom on Activities.
Panes — Oracle: "The Tracking window is divided into two or more panes, depending on the type of layout displayed." "The upper left pane, or Project Explorer window, always contains information about the available projects, and the upper right pane, or Top Layout window, always displays the current layout and layout options." "Depending on the type of layout you open, the left and right panes may be split horizontally to display additional panes on the lower half of the window. These include the Resource Explorer window on the lower left and the Bottom Layout window on the lower right." Display Options bar above each pane. From the Top Layout Display Options bar "you can show or hide the left columns, Top Layout window, or Bottom Layout window." Open a layout: Layout Name field in the Top Layout window. Save: Display Options bar in the Top Layout window > Layout, Save or Save As. Create: View > Layout, New, or Top Layout Display Options bar > Layout, New; name; Available To Current User or All Users; then pick the layout type.
Four layout types — Oracle: "You can create four types of tracking layouts: Project Bar Charts, Project Gantt/Profiles, Project Tables, and Resource Analyses." "Each of these layout types enable you to survey your project first at a comprehensive level, then at more detailed levels according to the Enterprise Project Structure (EPS), project, work breakdown structure (WBS), organizational breakdown structure (OBS), WBS category, or specific WBS data elements." "When you create and save a layout, only the presentation options are saved, not the data." "This enables you to use the layout with different projects." Select the project or EPS element in the Project Explorer window; click another item to present a different EPS element with the same layout. Available to all users (global) or a specific user. Open Layout dialog: Oracle printed that it identifies global tracking layouts and layouts assigned to specific users (icon sentences; the fetch dropped the icon names). Do not invent the icon names.
Summarized vs live — Oracle: "Review summarized or live project data at various levels of detail." "The Tracking window always displays summarized data for closed projects but also when you choose to open only global data." "When P6 Professional is connected to a P6 Professional database, note that summarized data are available only for projects that have been summarized in the Oracle Job Service." "For open projects, you can display live WBS data." Tip: select the project in the Project Explorer window, right-click, Project Details, Summary tab — "the date the summarizer was last run" and "the WBS level to which the project was summarized." Example: a project with four WBS levels summarized to WBS level 2 shows "rolled up values to the second WBS level for that project, when viewed in Summary mode." Resource data for projects that are not open: "it is necessary to run the summary job service to see the resource data. To view resource data live, open the projects." See Summarizer Stores Rolled-Up EPS Totals; It. Do not treat this window as the Summarizer command.
Sample layouts — Oracle: "The sample database includes several sample layouts that reflect common project analysis methods, for example, earned value, resource allocation, resource forecast, and total costs over time."
Project Table
Oracle: "displays project data in a table" / "in a row-and-column format." "You can specify which columns you want to include in the table." "The rows displayed correspond to your selection in the Project Explorer window and the current group and sort option." "You can group by project, EPS/WBS, OBS, phase, or by specific WBS data, and sort by any WBS-level column." "You can show grand totals and/or summary data only." Filters "to more narrowly define the information you see."
Project Bar Chart
Oracle: "displays project data in a horizontal bar chart." "A Project Bar Chart consists of bars representing either cost, unit, earned value, earned value labor unit, or total activities data for EPS nodes, projects, or WBS elements." "You can include up to three bars for any data category." Example: earned value data with bars for Planned Value Cost, Earned Value Cost, and Actual Cost. Color per bar; "stacked or included on the same line as the preceding bar." Left columns list the EPS node, project, or WBS; group by project, EPS/WBS, OBS, WBS category, or specific WBS data; grand totals and/or summary data only.
Project Gantt/Profile
Oracle: "displays project information in columns and a Gantt Chart in the Top Layout window and as time-distributed project data in spreadsheet or profile in the Bottom Layout window." "The Bottom Layout window also includes column data when you display a spreadsheet." "The Bottom Layout window shows time-distributed cost or unit data rolled up to WBS summary levels—these data are displayed as either a profile or spreadsheet."
Create: choose Project Gantt/Profile; then accept or add Gantt bars (Display, name, Timescale, Filter, Bar Style, Bar Labels). Customize: Top Layout Display Options bar > Top Layout Options (columns, bars, filters, group/sort, timescale); Bottom Layout Display Options bar > Bottom Layout Options. Display project data: Bottom Layout window profile or spreadsheet buttons (the fetch dropped the button icons).
Project profile — Profile Settings — Bottom Layout Display Options bar > Bottom Layout Options, Profile Settings (or the Bottom Layout toolbar). Data tab and Graph tab. Oracle titled the shared dialog help Project/Activity Usage Profile Options.
Data tab — Display: Cost or Units. "Display Actual and Earned Value using Financial Period data": mark it for past period actual values; do not mark it for actual to date values. If marked, "the profile displays past period actual values for the Actual bar and curve, the Earned Value curve, the Planned Value curve, and the Estimate at Completion curve." If projects are summarized by financial period (administrative setting), "this option is ignored." Then, with a financial period timescale: "the profile displays past period actual values if performance has been stored for a financial period; for financial periods that do not have stored performance, the profile displays actual to date values in financial period intervals."
Data tab — filters: "mark the checkbox next to each filter type" and a pattern. Cost: "you can select more than one filter"; "To display cost totals, mark the Total checkbox." Project Gantt/Profiles page: "filter labor, nonlabor, material, and/or expense data." The shared Data-tab dialog names Labor, Nonlabor, Material, Expenses (Cost only), Total (Cost only; "Total = Labor + Nonlabor + Expenses"). That dialog's "You cannot display expense units or total units on the spreadsheet" sentence names the spreadsheet. Do not invent that it is a Tracking profile rule.
Data tab — Show Bars/Curves — shared dialog: Baseline; Budgeted or Planned (Activity Usage Profile only); Actual; Remaining Early (Activity Usage Profile and Activity Profile only); Remaining Late (Activity Usage Profile and Activity Profile only). By Date and/or Cumulative; Color. Project Gantt/Profiles page: "define bars/curves to depict baseline, actual, and/or remaining values by date or cumulatively." Oracle labeled Budgeted or Planned Activity Usage Profile only. Do not invent Budgeted or Planned on Tracking's project profile. Oracle called the Tracking project profile Activity Profile on that dialog. Do not treat it as Activities Show on Bottom Activity Usage Profile.
Data tab — Show Earned Value Curves — Planned Value Cost / Labor Units; Earned Value Cost / Labor Units; Estimate at Completion Cost (EAC) / Labor Units. Same PV/EV expense-accrual note as Activity Usage Profile (Start of Activity / End of Activity vs Uniform).
Graph tab — Vertical Lines: Major / Minor timescale increments. Horizontal Lines. Additional Display Options: Show Legend ("a moveable legend"); 3D Bars; Background Color; Calculate Average; Divide Interval Totals By; Base on Hours Per Timeperiod; Unit of Measure. Base on Hours Per Timeperiod: increment from User Preferences for the date interval ("1h for Hour date interval, 2h for Shift date interval, 8h for Day date interval, 40h for week date interval, and so on"). Oracle did not print Show Values on the Tracking specify-project-profile Graph tab fetched. Do not invent it there.
Resource Analysis
Oracle: "displays time-distributed resource usage information in three formats: Gantt Chart, profile, and spreadsheet." "You can use a Resource Analysis layout to examine resource allocation for one or more specific projects and/or total allocation for all projects across the enterprise."
Top vs Bottom — Oracle: "The Top Layout window displays the selected resource's allocation for one or more individual EPS elements you select in the Project Explorer window." "The Bottom Layout window displays the selected resource's allocation for all projects in the enterprise." Specify-regular: "The profile displayed in the Top Layout window shows resource allocation for one or more projects you select in the Project Explorer window. The profile displayed in the Bottom Layout window shows one or more selected resources' total allocation across the enterprise." Display resource data: Top Layout profile or spreadsheet for the Project Explorer selection; Bottom Layout profile or spreadsheet for total allocation (all projects). You choose resources in the Resource Explorer window.
Resource Explorer — "displays in the left pane of the Tracking Bottom Layout window when a Resource Analysis layout is open." Display Options bar > Select View, By Resource ("Displays resources by resource ID") or By Role ("Displays all resources by role"). Filter By — By Resource: All Active Resources ("all resources assigned in the enterprise"); All Resources ("all resources defined for the enterprise"); Current Project's Resources ("resources assigned to the project currently selected in the Project Explorer window"); Customize. By Role: All Roles; Current Project's Roles; Customize. You can group and sort, and specify which column data to display. Resource security: Current Project's Resources = current project resources of the currently selected project only; All Resources / All Active Resources = resources you have access to plus current project resources for all selected projects (list grows as you select another project; "cleared only when you exit P6 Professional").
Create: choose Resource Analysis; then accept or add Gantt bars (same Bars dialog as Project Gantt/Profile). Customize: Top Layout Options or Bottom Layout Options. Stacked histogram: Display Options bar > Top Layout Options or Bottom Layout Options, Stacked Histogram, then Profile Settings. Resource Analysis layouts page: "You can also display a stacked histogram in the Bottom Layout window that displays the profile using different colors and patterns on bars to represents usage from different resources." Oracle printed both. Do not invent which page wins.
Resource profile — Regular Histogram — Profile Settings — Display Options bar > Top Layout Options or Bottom Layout Options, Profile Settings. Options "differ depending on whether you display the profile in resource or role view and on whether the profile displays resource allocation for one or more selected projects or total resource allocation across the enterprise."
Data tab — Display: Units or Cost. "Display Actual using Financial Period data": mark it for past period actual values; do not mark it for actual to date values. Same financial-period summarization ignore sentence as the project profile. If marked, "the profile displays past period actual values for the Actual bar and curve as well as the Show Overallocation and Show Available Units options."
Data tab — Show Bars/Curves — Oracle: "mark the checkbox to specify which unit/cost categories you want to display and whether to show this data by date or as a curve representing cumulative value. Select the color for each bar/curve." Oracle did not print the category names on the Tracking regular-histogram pages fetched. Do not invent one. Do not copy Activity Usage Profile's Baseline / Budgeted or Planned / Actual / Remaining Early / Remaining Late / PV / EV / EAC list onto this resource profile.
Data tab — remaining values (all projects / roles) — If the profile displays allocation across the enterprise (all projects), "you can choose how you want to display remaining values: as total remaining values across all projects in the enterprise, or as remaining values in the open projects vs. remaining values in closed projects." If displaying roles: "you can choose to view staffed vs. unstaffed units/costs. Staffed units are those for which resources have been assigned to fill role assignments." Preferences sentence names Show Remaining For, All Projects.
Data tab — Additional Data Options (Regular Histogram) — Oracle printed these names. Quote them.
- Show Limit: "Mark to display the resource's maximum units for each time unit in the current layout. This option is available only if you choose to display Units."
- Show Overallocation: "Mark to display overallocated values in the current layout. This option is available only if you choose to display Units and select Show Limit." Limits page: "You can choose to show resource limits only, but to show overallocation, you must also choose the Show Limit option."
- Show Available Units: "Mark to display a horizontal line that indicates the resource's available units. This option is available only if you choose to display All Projects." Availability page: "You can view resource available units only in the total allocation resource profile, not when displaying the Resource Profile for selected projects." "Although the Show Available Units checkbox is available only when you are viewing resource allocation for all projects across the enterprise, you can edit your user preferences to show resource availability only for open projects. In the Resource Usage/Role Profile Options dialog box, click Preferences, then click the Resource Analysis tab. In the All Projects section, choose Opened Projects Only."
- Show Overtime (open projects view only): "Mark to show the resource's overtime units for each time unit in the current layout."
Graph tab (Regular) — Vertical / Horizontal lines; Show Legend ("a moveable legend"); 3D Bars; Show Values; Background Color; Calculate Average; Divide Interval Totals By; Base on Hours Per Timeperiod (User Preferences increments, same 1h / 2h / 8h / 40h sentence); Unit of Measure.
Negative values — Regular and Stacked: "The histogram will only display bars that have positive values. Double-click in the profile to display the negative period values in the profile details." Availability page: "Bars and cumulative curves with negative values do not display in the profile."
Resource profile — Stacked Histogram — Top or Bottom Layout Options, Stacked Histogram, then Profile Settings. "The stacked histogram profile displayed in the Top Layout or Bottom Layout window shows resource allocation for one or more resource filters you specify in the profile settings." "You must add a resource filter that selects the resources to include in the profile, then specify the color and pattern for the filter's bar." "The profile legend in the left pane displays a list of the resource filters and their corresponding colors and patterns." Select View By Resource or By Role from the left-pane Display Options bar.
Data tab — Display: At Completion Units or At Completion Cost (not the Regular Histogram's Units or Cost pair). Same Display Actual using Financial Period data option.
Data tab — Show — "choose to show individual curves representing the cumulative value for each filter/group name of resources or choose to show one cumulative curve as a total for all filter/group names of resources." Add / modify / Delete resource or role filters. Example: "a filter that selects resources with the same resource code value." Pattern and Color; Up/Down arrows "arrange the filter list in the order it will display in the stacked histogram."
Graph tab (Stacked) — Vertical / Horizontal lines; 3D Bars; Show Values; Background Color; averaging / Unit of Measure. Oracle did not print Show Legend, Show Limit, Show Overallocation, Show Overtime, or Show Available Units on the Tracking stacked-histogram specify page fetched. Do not invent them on stacked.
Preferences — Resource Analysis tab (User Preferences) — Regular: "To specify the interval and dates to use to calculate time-distributed data for the profile, and to specify which projects are included (open only or open and specific closed projects) when you select the Show Remaining For, All Projects option, click Preferences. Then, click the Resource Analysis tab." Stacked: same click. That tab specifies "which projects are included in remaining value calculations and which dates and time interval are used to calculate time-distributed data for resource spreadsheets and profiles." All Projects: All closed projects (except what-if projects) — "Live data displays for open projects and stored summary data for closed projects"; All closed projects with leveling priority equal/higher than; Opened projects only. Time-Distributed Data: Remaining Early dates or Forecast dates. Interval for time-distributed resource calculations: if the layout timescale is lower than this interval, "the calculated amount displays in the first timescale increment." Display the Role Limit based on: Custom role limit, or Calculated primary resource's limit (default), with optional Exclude inactive resources. Oracle named Resource Usage Profile and Resource Usage Spreadsheet in that role-limit sentence. That is a User Preference for how role limits display. It is not an XER column on this window. See roles; do not treat ROLELIMIT as Tracking.
Forecast / dynamic leveling — Oracle: "You can use Resource Analysis forecasting features to create a what-if scenario for adjusting resource overallocation." "By including a bar that represents forecast dates in the Gantt Chart, you can dynamically adjust schedule dates and see the implications of the change in the resource profile." "If you decide to implement the schedule changes as a result of your forecasting, reschedule the project and use the project forecast start date." Need: a forecast bar in the Gantt Chart; display limits and overallocation in the resource profile; User Preferences to calculate time-distributed values using forecast dates. Drag the end of the forecast bar for an EPS/WBS element (pointer becomes a hand) left (earlier) or right (later). Restore: Top Layout window toolbar (the fetch dropped the button icon). To put the change into the schedule: Tools > Schedule; mark Set Data Date and Project Planned Start to Project Forecast Start During Scheduling; Options > General, mark Level Resources During Scheduling; then Schedule. This is not Tools > Level Resources as the Tracking command. See Resource Leveling Delays Work Until Units Fit. Do not invent that dragging the forecast bar is the leveler.
Timescale — Oracle: for Gantt, profile, and spreadsheet you specify a timescale and date format. Example: "a six-month range of actual values, time-distributed on a scale that uses fiscal year/month increments." Customize Resource Analysis: "When you adjust the timescale, it affects both the Top and Bottom Layout windows."
Spreadsheet fields — Display Options bar > Top Layout Options or Bottom Layout Options, Spreadsheet Fields: "one of three default spreadsheet fields" or Customize. Oracle did not print the three default field names on the page fetched. Do not invent them.
Filters / group / sort — For column or table data: View > Filter By, Customize, or Top Layout Options, Filters. Parameter Any of the Following / All of the Following; field; Is; Value. Group and sort using standard or custom settings.
Export / import / share / publish — Export: View > Layout, Open (or Display Options bar > Layout, Open); select the layout; Export; "The layout is saved in Primavera Layout File (. PLF) format." Import: same Open dialog, Import. Share: create as All Users (Oracle: "When you first create the layout (Tracking only)"); Save As to All Users or Another User; export the file; or publish to a Web site. Publish: Tools > Publish, Tracking Layouts; select layouts; location and filename "with no extension." Tracking layouts page also: "Tracking layouts can be published to Web sites and imported from and exported to spreadsheet programs." Oracle printed both the .PLF export and the spreadsheet-programs sentence. Do not invent that they are the same file. This is not Tools > Publish > Project Web Site (HTML project site). See Publication. This is not an Activities .plf. See Filters and Layouts Are a View, Not the Schedule. Visualizer uses .vlf. See Visualizer.
Thresholds and issues — Oracle: "To help you monitor a project's problem areas, you can assign tracking layouts to thresholds and issues." Thresholds: Project > Thresholds, General tab, Tracking Layout field. Issues: Project > Issues, General tab, Tracking Layout field. "When you assign a default tracking layout to an issue, you can quickly view issue details through the Issue Navigator." Thresholds: "use the Issue Navigator to quickly open the tracking layout that best displays the threshold's issue details." See Issues and Thresholds — Not Schedule Logic. The assignment is a pointer. It is not the layout definition.
Curves, typed buckets, and this window — Oracle: you can "compare the planned future period resource distribution to actual units and costs in the Resource Usage Profile, Resource Usage Spreadsheet, Activity Usage Profile, Activity Usage Spreadsheet, time-distributed reports, and the Tracking window." You do not type buckets here. See Future Period Buckets Are Typed Assignment Units, Not a Curve.
This is not Resource Usage Profile (Activities Show on Bottom; left-pane resource/role list; Display Activities for Selected). Oracle on that view: "The Resource Usage Profile is available only in the bottom layout of the Activities window." Tracking uses Top Layout Options / Bottom Layout Options, Profile Settings, Project Explorer / Resource Explorer.
This is not Activity Usage Profile (Activities Show on Bottom activity histogram). Oracle labeled some shared Data-tab bars Activity Usage Profile only.
The Professional pages fetched do not print an EPPM web Tracking window. EPPM web Resource Analysis / Team Usage (published data) is not Enterprise > Tracking. Do not invent a web Tracking view from Publication or cost-spread sentences that name Resource Analysis.
XER
The window is a Professional layout (Enterprise > Tracking). Oracle's project XER data map TOC lists no TRACKING, TRACK, LAYOUT, PROFILE, HISTOGRAM, or VIEW table. Do not invent one. Layouts export as .PLF, not XER. "When you create and save a layout, only the presentation options are saved, not the data." Profile Settings (Cost vs Units vs At Completion Units/Cost, Regular vs Stacked, bar/curve picks, colors, filters, Show Limit / Overallocation / Available Units / Overtime), timescale, Project Explorer / Resource Explorer selection, Top vs Bottom, and layout type are not columns on the cited TASK or TASKRSRC maps. Oracle did not name an XER table or column for the layout definition.
PROJISSU.track_view_id and PROJTHRS.track_view_id are labeled Tracking Layout. That is a pointer on the issue or threshold (General tab, Tracking Layout field). It is not the layout. See Issues and Thresholds — Not Schedule Logic.
ROLELIMIT is on the TOC (Role Limits). That is not this window.
What you can display as bars or curves is not a dedicated Tracking table:
- Typed future-period buckets: no dedicated table. See Future Period Buckets Are Typed Assignment Units, Not a Curve.
- Named curves:
RSRCCURV/TASKRSRC.curv_id. See Resource Curves (Not MSP Work Contours). - Stored past-period actuals:
TASKFIN/TRSRCFIN. See Store Period Performance Posts This Period, Then Zeros It. - Named financial-period calendar:
FINDATES. See Financial Periods Are Named Buckets, Not the Data Date. - Summarizer flags:
PROJECT.batch_sum_flag/sum_data_date/last_tasksum_date/sum_only_flag/wbs_max_sum_level. See Summarizer Stores Rolled-Up EPS Totals; It. Those are not this window.
A Viewer parse of one XER cannot reconstruct whether the planner had Enterprise > Tracking open, which of the four layout types, Project Explorer / Resource Explorer selection, Regular vs Stacked, Top vs Bottom, Profile Settings, or the last timescale. track_view_id on an issue or threshold, if present, is only the assigned layout pointer — not the .PLF.
Microsoft Project
Desktop Project has Resource Graph. Microsoft: "View resource allocation, cost, or work over time for a single resource or group of resources at a time. Information is displayed in a column graph format." "The Resource Graph view displays a bar chart view of an individual resource's workload and availability." Resource tab > Resource Graph. Blue bars (default) are at or below max units; red bars are overallocation. Format > Graph can show Work Availability. Closer to a resource histogram than to Tracking's four-layout window.
Desktop Project has Resource Usage. Microsoft: "Review, enter, and edit assignments by resource." Usage views "list task or resource data in rows and columns on the leftmost side of the view, and show timephased data across rows and columns on the rightmost side of the view." Closer to Resource Usage Spreadsheet than to Tracking.
Desktop Project has Reports and Visual Reports. Microsoft: Report > Resources (Overallocated Resources, Resource Overview). Report > Visual Reports builds an OLAP cube into Excel or Visio (templates include Resource Work Summary, Resource Work Availability, Resource Cost Summary). Closer to a report than to Enterprise > Tracking.
Desktop Project has Gantt Chart. That is a task bar chart. It is not Tracking Project Gantt/Profile (EPS/project/WBS columns plus a bottom project profile rolled up to WBS summary levels).
They are not the same object as Tracking. Oracle's Tracking window is Enterprise > Tracking with Project Explorer / Resource Explorer and four layout types (Project Table, Project Bar Chart, Project Gantt/Profile, Resource Analysis). Microsoft's Resource Graph is a column graph of one resource at a time. Microsoft's Resource Usage is a timescaled assignment grid you can edit. Microsoft's Reports / Visual Reports are reports.
Do not map Resource Graph, Resource Usage, Reports, Visual Reports, or Gantt Chart as the same command as Tracking. Do not claim MPXJ can write a real MPP.
Don't
- Treat Tracking as Resource Usage Profile, Activity Usage Profile, Resource Usage Spreadsheet, or Activity Usage Spreadsheet (Activities Show on Bottom / Show on Top).
- Treat it as the place you type future-period buckets, as a 21-point
RSRCCURV, as FINDATES, as TASKFIN / TRSRCFIN, as Planning-page WBSRSRC_QTY, or as ROLELIMIT. - Treat it as the Summarizer command, as Enable Publication, or as Tools > Publish > Project Web Site.
- Treat EPPM web Resource Analysis / Team Usage (published data) as Enterprise > Tracking.
- Treat dragging a forecast bar as Tools > Level Resources.
- Treat
track_view_idas the layout definition, or as proof the .PLF is in the XER. - Invent a TRACKING / TRACK / LAYOUT / PROFILE / HISTOGRAM / VIEW XER table.
- Invent a Regular Histogram bar/curve catalog (Budgeted or Planned / Actual / Remaining Early / Remaining Late or any other list). Oracle only printed "unit/cost categories" and by-date vs cumulative on the Tracking resource profile.
- Invent Budgeted or Planned on Tracking's project profile (Oracle labeled it Activity Usage Profile only).
- Invent Show Limit / Overallocation / Overtime / Available Units or Show Legend on Stacked Histogram (Oracle did not print them there).
- Invent the three default spreadsheet field names (Oracle did not print them).
- Copy Activities Show on Bottom Display Activities for Selected / Resource / Time Period onto Tracking.
- Copy Resource Usage Spreadsheet's Assignments checkbox, three-pane Open Projects Only layout, gray cells, or Range Paste onto Tracking.
- Map this object to MSP Resource Graph, Resource Usage, Reports, Visual Reports, or Gantt Chart and call them the same.
- Claim MPXJ writes a real MPP.
- Claim a Viewer reconstructed the planner's last Tracking layout type, explorers, Profile Settings, Regular vs Stacked, or timescale from an XER.
Sources
- Oracle Tracking window [27 Aug 2026]
- Oracle Tracking [27 Aug 2026]
- Oracle Tracking layouts [27 Aug 2026]
- Oracle Types of tracking layouts [27 Aug 2026]
- Oracle Create a tracking layout [27 Aug 2026]
- Oracle Project Table layouts [27 Aug 2026]
- Oracle Project Bar Charts [27 Aug 2026]
- Oracle Project Gantt/Profiles [27 Aug 2026]
- Oracle Create a Project Gantt/Profile [27 Aug 2026]
- Oracle Customize a Project Gantt/Profile [27 Aug 2026]
- Oracle Display project data as a profile or spreadsheet [27 Aug 2026]
- Oracle Specify a project profile's data, filter, and… [27 Aug 2026]
- Oracle Data tab - Project/Activity Usage Profile Options [27 Aug 2026]
- Oracle Resource Analysis layouts [27 Aug 2026]
- Oracle Create a Resource Analysis tracking layout [27 Aug 2026]
- Oracle Customize a Resource Analysis layout [27 Aug 2026]
- Oracle Display resource data as a profile or spreadsheet [27 Aug 2026]
- Oracle Resource Explorer window [27 Aug 2026]
- Oracle Specify how resources are listed in the Resource… [27 Aug 2026]
- Oracle Filter resources in the Resource Explorer window [27 Aug 2026]
- Oracle Specify a resource profile's data and display… [27 Aug 2026]
- Oracle Specify a resource profile's data and display… [27 Aug 2026]
- Oracle Display past period actuals in a profile [27 Aug 2026]
- Oracle Show or hide resource limits and overallocation… [27 Aug 2026]
- Oracle Show or hide resource availability in a profile [27 Aug 2026]
- Oracle Resource Analysis tab - User Preferences [27 Aug 2026]
- Oracle Using Resource Analysis forecasting to… [27 Aug 2026]
- Oracle Dynamically level resources [27 Aug 2026]
- Oracle Select spreadsheet data fields [27 Aug 2026]
- Oracle Filter a tracking layout [27 Aug 2026]
- Oracle Export a tracking layout [27 Aug 2026]
- Oracle Import a tracking layout [27 Aug 2026]
- Oracle Share a layout with other users [27 Aug 2026]
- Oracle Publish tracking layouts [27 Aug 2026]
- Oracle Assign a tracking layout to an issue [27 Aug 2026]
- Oracle Assign a tracking layout to a threshold [27 Aug 2026]
- Oracle Future period bucket planning [27 Aug 2026]
- Oracle The Resource Usage Profile [27 Aug 2026]
- Oracle The Activity Usage Profile [27 Aug 2026]
- Oracle XER project map TOC [27 Aug 2026]
- Oracle XER project map PDF [27 Aug 2026]
- Microsoft Overview of Project views [27 Aug 2026]
- Microsoft View resource workloads and availability [27 Aug 2026]
- Microsoft Pick the right report in Project [27 Aug 2026]